
One vending machine on an apartment lot: 122,000 yen paid out, 3,778 units sold in a year — the 86,000-yen profit, broken down
A full-year record of one vending machine installed at a 24-unit apartment building. The operator received 122,000 yen from the vending company, sold 3,778 units, and after subtracting 36,000 yen in electricity, netted 86,000 yen in profit. The dips in August and January reveal exactly where the sales were coming from.
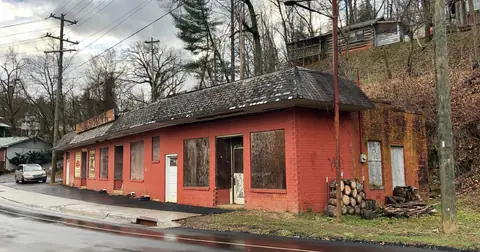
If you install one vending machine on the ground floor of a rental apartment building, how much does it bring in over a year? The operator of the blog “Chittoku Blog” has published a full 12-month record, from June 2020 through May 2021, complete with a monthly chart. Actual revenue paid out by the vending operator came to about 122,000 yen, with 3,778 units sold, netting roughly 86,000 yen after subtracting electricity costs.
Individual posts disclosing a year’s worth of side income at this scale, down to unit counts, are rare. And because the same author published a separate article covering the commission rate and single-month results under a full-operation contract, cross-referencing the two lets us reverse-engineer where the vending machine’s sales were actually coming from.
Setup conditions and the year’s results
| Item | Detail |
|---|---|
| Location | Ground floor of a 24-unit apartment building for single occupants |
| Surroundings | A two-lane road with sidewalks on each side, near a university and a high school |
| Period | June 2020 (mid-month install) – May 2021 |
| Machine type | A slightly smaller model with 10 slots × 3 rows |
| Operating model | Full-service (restocking, cleaning, and repairs handled by the vending company) |
| Annual payout | About 122,000 yen |
| Annual electricity | About 36,000 yen (3,000 yen/month × 12) |
| Annual profit | About 86,000 yen |
| Annual units sold | 3,778 (just over 10 a day) |
One thing worth flagging here: far from being “sales”, the 122,000 yen is the “revenue actually paid out by the vending machine company,” meaning the property owner’s take. Confuse this and every downstream calculation goes off.
Working backward from the fee structure to real sales
The same author explains the mechanics in a separate article. There are two contract types: full-service, where the company handles installation, restocking, cleaning, and repairs, and semi-service, where the owner buys the machine and runs it themselves. Under full-service, upfront cost is zero and effort is minimal, but the owner’s take is around 20% of the sale price. Revenue is determined by “units sold × sale price × 0.2 − electricity cost.”
This author’s margin rate is stated as 25%. The same article gives single-month results for July 2020: 487 units sold, 64,210 yen in sales, about 3,000 yen in electricity, netting about 13,000 yen. Checking the math: 64,210 × 25% = 16,052 yen. Subtract electricity and you get 13,052 yen, which matches. Average unit price works out to 64,210 ÷ 487 ≈ 132 yen.
Applying this per-unit price and margin rate to the year’s total gives the following.
| Metric | Value | Basis |
|---|---|---|
| Annual units sold | 3,778 | Stated in the article |
| Estimated annual sales (machine-level) | ~490,000 yen | 3,778 units × ~130 yen |
| Payout to owner | ~122,000 yen | Stated in the article. About 25% of sales |
| Electricity | ~36,000 yen | 3,000 yen × 12 |
| Net profit | ~86,000 yen | Payout − electricity |
| Monthly average | Payout ~10,167 yen / profit ~7,167 yen | Annual figures ÷ 12 |
What this reveals is how thin the margin really is. Roughly 490,000 yen worth of product sold, and only 86,000 yen makes it back to the owner, 17.6% of total sales. And of that 122,000-yen payout, electricity at 36,000 yen eats up 29.5%. That’s 30% of the owner’s own take, not 30% of sales. The economics of a full-service vending machine are driven less by the commission rate than by the fixed-cost weight of electricity relative to payout.
No turning point. What worked was purely the location
There’s no dramatic turning point in this case. Over the full year, the author’s only action was “occasionally telling the vending company when a slot was empty.” No promotional tactics of any kind were run. Restocking and trash cleanup were both handled by the company, and the author describes it as “close to passive income.”
So what determined the result? The answer was already settled before installation: site selection.
The evidence is in the monthly variation. The author notes: “revenue in August and January was likely lower because the nearby schools were on summer and winter break.” This single sentence carries the most information in the entire article.
Think it through: if the buyers were primarily the building’s 24 residents, there’s no reason for a dip in August or January. Residents live there year-round. The fact that revenue tracks school vacation periods instead means the buyers are mainly people walking past the building, commuting students, not residents.
The unit count corroborates this. Just over 10 units a day divided across 24 units works out to about 0.4 units per resident per day. It’s hard to imagine single-occupancy residents buying 0.4 units a day, every day, from a machine right outside their own door. In other words, this machine’s sales are coming not from inside the building, but from outside it, university and high school students on the sidewalk along that two-lane road.
Read this way, what actually drove success becomes clear: less “owning an apartment building” than “owning a lot with an available power hookup, sitting directly on a university and high school commuting route.” The same 24-unit building set away from that commuting route would likely have produced very different results.
What was surprising, and what didn’t work
The author notes being surprised that winter revenue held up relatively well. Vending machines conjure images of summer beverage demand, but in this data, August was actually the low month. If student demand is the driver, this makes sense, foot traffic matters more than temperature as the dominant variable.
As for “what didn’t work”. There’s nothing to describe, because no tactics were tried at all. Flip that around, and it means there’s essentially no room to improve results after installation. The company chooses the product lineup, the company sets prices, and the only lever available to the owner is reporting an empty slot. There’s no revenue lever the owner actually controls.
Opinions will differ on whether 86,000 yen a year is worthwhile. With effort at essentially zero, the hourly-rate math is extremely favorable. But the absolute amount is a bit over 7,000 yen a month, not enough on its own to change anyone’s life. The author himself frames it conditionally, recommending it for “people who have unused land and access to a power hookup.”
What’s reproducible, and what isn’t
What’s easy to reproduce is the zero-upfront-cost entry condition. Choosing full-service means no purchase of the machine itself, going semi-service with a new unit would cost 900,000–2,000,000 yen (10,000 yen+ used), but full-service lets the vending company shoulder all of it. Exit is just as simple, requiring only restoring the space. In terms of risk, this article’s assessment (“almost no risk, and it doesn’t take up time”) holds up.
What’s harder to reproduce is what comes before that: three conditions. First, control over a plot of land or lot where a machine can be installed. Second, an available power source. Third, and most important, foot traffic. This case had a university and a high school nearby, on a sidewalk-lined two-lane road. That set of conditions can’t be built through effort. You either happen to have it or you don’t.
One more thing not to overlook: full-service vending companies also need the numbers to work on their end, so a contract only happens if the company judges the location worth placing a machine at. The fact that this installation happened at all is itself evidence it passed the company’s site screening. Conversely, forcing a semi-service setup in a location the company would decline means shouldering the initial investment while still facing the same lack of demand.
The numerical limits are worth stating plainly too. What’s published is one machine, one location, twelve months of data, with the monthly actuals shown only as a chart. The 25% margin rate is specific to this contract, the same author notes that around 20% is more typical elsewhere. Whether results scale proportionally with more machines also can’t be determined from this article.
Related reading
- Rental Space — actual figures from an offline business monetized by renting out space
- Kitchen Car — another on-the-ground case where location and foot traffic determine sales
If this one impressed you
Similar cases
An Engineer's Side-Business Rental Spaces: ¥7.5 Million in Year One Across Three Locations. Measured Unit Economics of a 25m², ¥450,000-Upfront Space
Offline
Is a coin laundry passive income? ¥150,000-500,000 a month, 7-10 year payback — an owner's numbers
Offline
23 indoor storage units in Shizuoka, ¥65,000 profit at full occupancy. Inside a solo investor's published 50% break-even point
Offline
TF's apps: ¥103,437 in Year Eight — A Shiga Salaryman Who Kept Publishing His Ad Revenue Every Month, and Hit ¥20,000/Month in Year Nine
Mobile appMost read
- 1
Payout: A Class-Action App Vibe-Coded in 14 Days Reached $1,003,227 ARR in 9 Months. It Cost About $10 to Build, and a Partner With 10 Million Followers Grew It
43 recent visits - 2
Starter Story: The $91.7K/Month Startup Case-Study Media Acquired by HubSpot — Months After the Founder Tweeted "HubSpot Should Acquire Starter Story"
35 recent visits - 3
Instatus: $48K MRR with Every Metric Public, After Dropping "Sup" and Repricing Upmarket
23 recent visits - 4
From 30 yen in revenue to 8 years later: how running 3 apps in parallel got an indie developer to 200,000 yen a month
20 recent visits - 5
¥4.61 Million a Year, Five Years After Starting to Learn Programming. The Full Three-Year P&L and Playbook of an Indie Education App
19 recent visits
Latest articles
- 2026-10-20
An 18-Year-Old French Pâtisserie Changed Hands for ¥8M With 1–2 Weeks Left Before Closing — And the 29-Year-Old Buyer Never Negotiated the Price
- 2026-10-20
Traffic Think Tank: a six-year side-hustle SEO community sold for $1.8M, with 40% paid later
- 2026-10-20
Doing Content Right: After Four Side Projects That Made $0, a $99 Ebook Did $130K in Eight Months
- 2026-10-20
Ali Abdaal: Of $5.5M in 2023 Business Revenue, $3.5M Came From Courses — YouTube Was the Funnel, Not the Product
- 2026-10-19
Ozeki Sangyo: A Factory "Two Months From Death" Changed Hands for ¥13M — ¥11M of It an Apartment, Not Cash
Sources
- Founder 知っ得ブログ「マンションに自動販売機を1年間設置した収益を公開」
- Founder 知っ得ブログ「【実際の収益も公開】自動販売機ビジネス」