
Month One Paid ¥400 an Hour: Four Months of Fully Disclosed Kitchen Car Sales — and the Fifth Month, When COVID Stopped Everything
Real month-by-month data from a kitchen car's first 4 months. Month one: 8 days of vending, ¥64,000 in sales and ¥28,000 in profit (about ¥400/hour by the owner's reckoning). By month four: ¥384,000 in sales, ¥334,000 in profit. Best single day: ¥50,000. Then, in month five, COVID erased the vending venues — rare public data capturing both the ramp-up and the fragility.
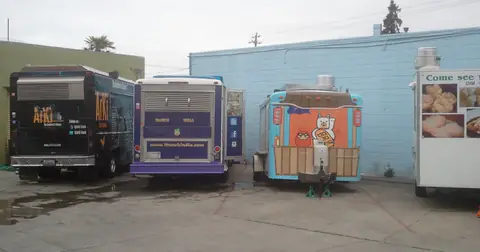
Information about starting a kitchen car tends to originate from those “selling the dream”, franchise headquarters and vehicle dealers, so business plans premised on profitability from month one circulate widely. This article deals with primary data at the opposite pole. A crepe kitchen car launched in December 2019 disclosed all of its sales, venue fees, ingredient costs, and profits for four months, and recorded the full sequence up to month five, when COVID brought everything to a halt. The ramp-up curve and the fragility of the business are captured in one and the same dataset.
The First Vending Day — 100 Servings Targeted, 8 Sold
The writer, a former firefighter, made his first appearance on November 30, 2019. He prepped with the ambition of “selling 100 servings in a day,” but sold 8 crepes for ¥4,000 on day one. The following day brought 25 crepes and ¥12,500. He later wrote: “I understand the urge to go all-out at your first vending, but you need to think coolly.”
There was a second stumble. The venues he had imagined before opening, shopping malls and parks, turned out to be “mostly places where you can’t vend, or places that charge steep fees.” In his very first month, he learned that the barrier to entry in the kitchen car business is neither cooking nor permits but securing vending slots.
The Monthly Record — Expenses Included
| Month | Vending days | Sales | Venue fees | Ingredients | Profit |
|---|---|---|---|---|---|
| December (launch) | 8 days | ¥63,500 | ¥19,350 | ¥15,875 | ¥28,275 |
| January | 17 days | ¥273,780 | ¥38,500 | ¥70,000 | ¥165,280 |
| February | 17 days | ¥424,370 | ¥34,600 | ¥80,250 | ¥309,520 |
| March | 16 days | ¥383,650 | ¥28,140 | ¥95,491 | ¥333,828 |
- 4-month totals: ¥1,145,300 in sales, ¥836,903 in profit
- Best single day: ¥50,800 (Michi-no-Eki Motegi — 87 crepes in about 4 hours)
- Cost structure: venue fees around 15% of sales, ingredient cost ratio set at 25–30%, vehicle loan ¥54,000/month
- Even full-time, 17 vending days per month is the ceiling (stamina and weather)
- Month five (April 2020): COVID wiped out the vending venues; operations suspended
His summary of the first month: “Profit: ¥28,000. That’s ¥3,500 a day, about ¥400 an hour.”
What the Venue-Fee Ratio Trend Tells Us
Read the table vertically and a second curve appears. Venue fees as a share of sales plummet: roughly 30% in December (¥19,350/¥63,500), about 14% in January, about 8% in February, about 7% in March. In the first month he was “paying relatively high fees for spots that don’t sell”, as his track record accumulated, he could choose cost-effective slots. The 12x profit growth was driven not by menu improvements but by improvement in venue quality, a conclusion the expense-side numbers corroborate. Slots at high-traffic locations like roadside stations don’t come around without accumulated results and trust.
Look at ingredient cost ratios too: 25.0% in December → 25.6% in January → 18.9% in February → 24.9% in March, stable near the lower bound of the target range (25–30%) from the start. Cost control, then, had almost no room for improvement from month one. The variable moving profit was concentrated on the venue side, which the expense breakdown confirms.
Sales-technique adjustments also worked. When foot traffic stalled, he introduced a small ¥200 crepe, and “once I started selling the small ¥200 crepe, every product started selling.” The low-priced item served as a psychological entry point that set the flagship products moving. He also varied prices by location. His felt experience: “by month three you get quite used to it”. The time constant of mastery was about one quarter.
The Distribution of Daily Sales, and This Format’s Ceiling
March’s average daily sales were about ¥24,000 (¥383,650 ÷ 16 days). The best day, ¥50,800, is more than double that, showing how much a single outlier venue like the roadside station lifts the month. The ceiling can be estimated too: even if every vending day matched the best day, monthly sales would be about ¥860,000 (¥50,800 × 17 days). Since 17 days per month is the wall of stamina and weather even for a full-timer, one truck plus one person structurally struggles to reach ¥1,000,000 in monthly sales. Scaling this format requires a second truck or hired staff. A P&L structure you can back out of four months of data.
What Didn’t Work
- Over-prepping on the first day: 100 servings planned, 8 sold, ambition converted directly into inventory loss
- Most pre-launch venue candidates were “unavailable or expensive”; the desk-drafted vending plan barely functioned
- And in month five, COVID erased the events and venues themselves. “I wanted to build up about a year of track record,” he wrote with regret. Spring is considered the kitchen car’s peak season — the business stopped right on its doorstep
What Remains in the Month Everything Stops
The heaviest number in this case is neither sales nor profit but the ¥54,000 monthly vehicle loan. It keeps going out even in months with no vending. While ¥330,000 in monthly profit is coming in, it’s a rounding error. In a zero-sales month it becomes a fixed outlay on par with living costs.
Structurally: (1) the vehicle can be sold on the used market (not a total sunk cost), (2) permits, vending track record, and venue relationships carry over to a restart, (3) but the loan remains as residual debt. Estimate your initial investment not as “the amount you could lose” but as “the monthly burden when things stop”. That’s how the risk of this kind of business is measured accurately.
In contrast to stock photos that kept paying ¥50,000 a year even when left alone, a kitchen car goes to zero the moment you or the market stops, with only the loan left behind. It is a more extreme form of reselling’s “sales drop in months you can’t move”.
Conditions for Reproducing This
Strip out the specifics of this kitchen car and one structural claim remains: an offline mobile-vending launch is determined by the venue acquisition curve. With skill and product roughly constant, profit differed 12x between December and March. Competence in mobile food vending is not cooking but the salesmanship and relationships to win good vending slots, and acquiring them takes 3–4 months of accumulated track record. The ¥400/hour first month is not evidence of failure but simply the starting point of this curve.
At the same time, the initial investment stayed in the low millions of yen, and ¥330,000 in monthly profit was reached in four months. Compared with opening a fixed-location restaurant, where interiors alone can cost millions, the risk really is smaller, and the numbers vindicate the value of “testing small.” Note, however, that these monthly figures predate COVID, and venue-fee rates and event availability depend heavily on region and season. What’s portable is less the amounts than the operating pattern: record venue-fee ratio and cost ratio monthly, and score venue quality with numbers.
Related Reading
Sources
Similar cases

Mirai Shokudo: A Jimbocho Diner That Published 4 Years of Books — ¥34,000 a Day, 23% Food Cost
Offline
A 23-year-old's 17-square-meter crepe shop topped ¥1M/month. Why the profitable owner still called it a "failure"
Offline
2 rental-space locations, a 2.2-million-yen loss over 29 months: the full numbers behind 730,000 yen in sales and 95 bookings
Offline
Full numbers from 3 rural minpaku properties: a leased + inn-license property paid back in 17 months on 3.45 million yen upfront — double the yield of a Housing Business Act property
OfflineMost read
- 1
Peak Monthly Sales of ¥1 Million on minne. A Former Designer Turned Handmade Artist Explains the Craft of "Photos That Sell"
34 recent visits - 2
Six AI videos, ¥153,030 in the first month — one video with 4.22 million views drove two-thirds of TikTok monetization revenue
21 recent visits - 3
From 30 yen in revenue to 8 years later: how running 3 apps in parallel got an indie developer to 200,000 yen a month
19 recent visits - 4
Side-Business Blog "Tsuzuki Blog": From ¥42,000 to ¥1 Million a Month in One Year. Breaking Down the Published Monthly Data
15 recent visits - 5
Shichinatsu: A Salaried Designer's BOOTH Asset Shop Sells ¥1.08M in Six Months — Every Monthly Figure From ¥100K to ¥250K, Disclosed
13 recent visits
Latest articles
- 2026-09-26
Genji Reincarnation: 32 copies in month one, and a payout of zero
- 2026-09-25
Pirsch Analytics: One-Employee GA Alternative Grows MRR From $11,000 to $14,300, Publishing Its Numbers Every Year
- 2026-09-25
Kokou no Tabibito: A Multi-Topic Blog Hitting 500K Monthly PV and ¥300,000/Month in About a Year
- 2026-09-24
Fomo: a $10,000 MRR widget bought on seller financing, a best month of $154,000, and a seven-figure sale to Relay Commerce six years later
- 2026-09-23
Okashi Kaigyo Lab: a 13-tsubo cake shop booked ¥27,073,172 in year three and published every monthly sales figure to the yen